Best System Monitoring Software For Linux And Windows
Users will notice performance problems with the software that they use, but those problems rarely arise within that software. All layers of the application stack need to be examined to find the root cause of performance issues. You need to head off problems with real-time monitoring before they occur. Monitoring tools help you spot errors and service failures before they start to impact users.
The system stack continues on below the software. Hardware issues can be prevented through monitoring. You will need to monitor servers, network devices, interface performance, and network link capacity. You need to monitor many different types of interacting system elements in order to keep your IT services running smoothly. Here we’ll look at six sophisticated system monitoring packages for Windows and Linux.
Why system monitoring
Knowing whether a computer has issues is fairly straightforward when the computer is right in front of you. (Knowing what’s causing the problem? That’s harder.)
But a computer sitting by itself is not as useful as it could be. Even the smallest small-office/home-office network has multiple nodes: laptops, desktops, tablets, WiFi access points, internet gateway, smartphones, file servers and/or media servers, printers, and so on. That means you are in charge of “infrastructure” rather than just “equipment.” Any component might start behaving badly and could cause issues for the others.
You most likely rely on off-premises servers and services, too. Even a personal website raises the nagging question, “Is my site still up?” And when your ISP has problems, your local network’s usefulness suffers. You need an activity monitor. Organizations rely more and more on servers and services hosted in the cloud: SaaS applications (email, office apps, business packages, etc); file storage; cloud hosting for your own databases and apps; and so on. This requires a sophisticated monitoring solution that can handle hybrid environments.
Bandwidth monitoring tools and NetFlow- and sFlow-based traffic analyzers help you stay aware of the activity, capacity, and health of your network. They allow you to watch traffic as it flows through routers and switches, or arrives at and leaves hosts.
But what of the hosts on your network, their hardware, and the services and applications running there? Monitoring the activity, capacity, and health of hosts and applications is the focus of system monitoring.
System monitoring basics
In order to keep your system fit for purpose, your monitoring activities need to cover the following priorities:
- Acceptable delivery speeds
- Constant availability
- Preventative maintenance
- Software version monitoring and patching
- Intrusion detection
- Data integrity
- Security monitoring
- Attack mitigation
- Virus prevention and detection
Lack of funding may cause you to compromise on monitoring completeness. The expense of monitoring can be justified because of it:
- reduces user/customer support costs
- prevents loss of income caused by system outages or attack vulnerability
- prevents data leakage leading to litigation
- prevents hardware damage and loss of business-critical data
Expense on system monitoring reduces costs in other areas of the IT budget.
Basic system monitoring tools
Anyone who’s curious about their workstation or laptop’s performance has likely encountered Windows Task Manager or Linux’s ps and top. (The more experienced know of Sysinternals on Windows and htop, atop, pgrep, and pstree on Linux.)
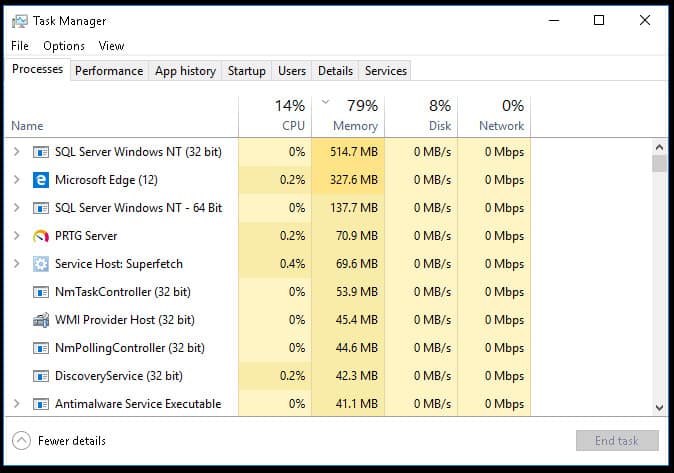
Task Manager is a good example of the basic activity monitoring information you can learn about a host, starting with what processes are running and which currently consume the most resources.
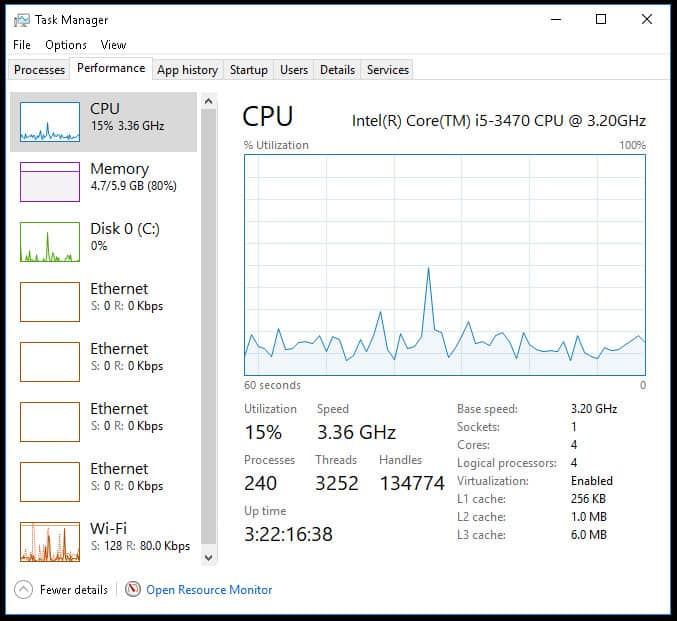
Climb up a level and it will show you current and recent utilization for key resources like CPU, memory, disk, and network connections. Other tabs will show you more details on running processes, operating system services, and other key data.

Unix and Linux have analogous tools, like top.
Task Manager and top provide a continuously updating display of utilization. These simple real-time monitoring utilities are good for basic ad hoc monitoring of a single machine, to see what’s running and what’s consuming the system’s resources.
Minimum system monitoring software capabilities
A more sophisticated system monitoring package provides a much broader range of capabilities, such as:
- Monitoring multiple servers. Handling servers from various vendors running various operating systems. Monitoring servers at multiple sites and in cloud environments.
- Monitoring a range of server metrics: availability, CPU usage, memory usage, disk space, response time, and upload/download rates. Monitoring CPU temperature and power supply voltages.
- Monitoring applications. Using deep knowledge of common applications and services to monitor key server processes, including web servers, database servers, and application stacks.
- Automatically alerting you of problems, such as servers or network devices that are overloaded or down, or worrisome trends. Customized alerts that can use multiple methods to contact you – email, SMS text messages, pager, etc.
- Triggering actions in response to alerts, to handle certain classes of problems automatically.
- Collecting historical data about server and device health and behavior.
- Displaying data. Crunching the data and analyzing trends to display illuminating visualizations of the data.
- Reports. Besides displays, generating useful predefined reports that help with tasks like forecasting capacity, optimizing resource usage, and predicting needs for maintenance and upgrades.
- Customizable reporting. A facility to help you create custom reports.
- Easy configurability, using methods like auto-discovery and knowledge of server and application types.
- Unintrusiveness: imposing a low overhead on your production machines and services. Making smart use of agents to offload monitoring where appropriate.
- Scalability: Able to grow with your business, from a small or medium business (SMB) to a large enterprise.
The best system monitoring tools
Apart from having the minimum system monitoring software capabilities that we listed above, when selecting the tools in this post, we also took some of the following criteria into consideration:
- Ease of installation and use, including the availability of documentation, community forums, and support
- Commitment to continual updates, improvements, and ongoing maintenance.
- Real-world problem-solving applicability and a robust feature set.
List Of System Monitoring Software
- Solarwinds SAM (Server & Application Monitor
- PRTG by Paessler
- OPManager by ManageEngine
- Nagios
- WhatsUp Gold
- Zabbix
- Spiceworks
1. Solarwinds Server and Application Monitor
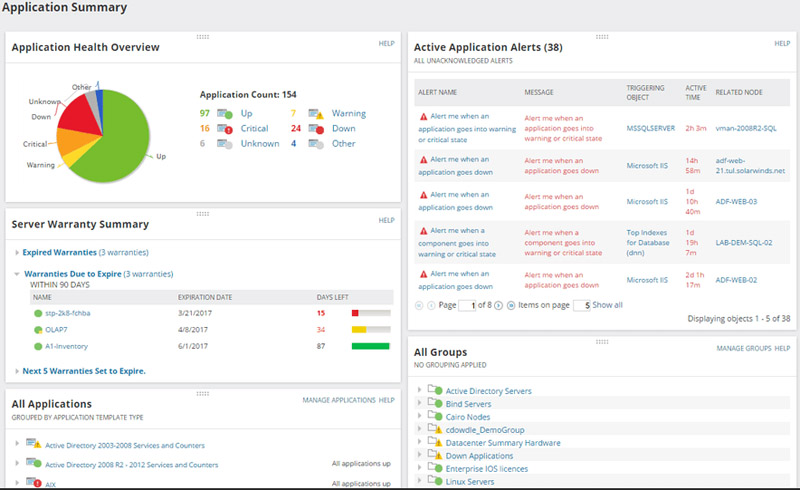
Solarwinds, has been a long-time leader for IT enterprise infrastructure management software. They developed the Server & Application Monitor “SAM”, a software very easy to install and use. The tool has a simple dashboard which is intuitive for any experienced IT admin.
SAM is perfect for monitoring services and performance counters. It can be used to monitor a large variety of applications (+200) from a single dashboard. The dashboard comes preconfigured so that you can easily start the software out-of-the-box with little or no tweaking.
SAM is a great tool for Real-time Monitoring and Management but is also amazing for collecting and reporting data from different agents from a central server.
Official website:
http://www.solarwinds.com/server-application-monitor
2. PRTG
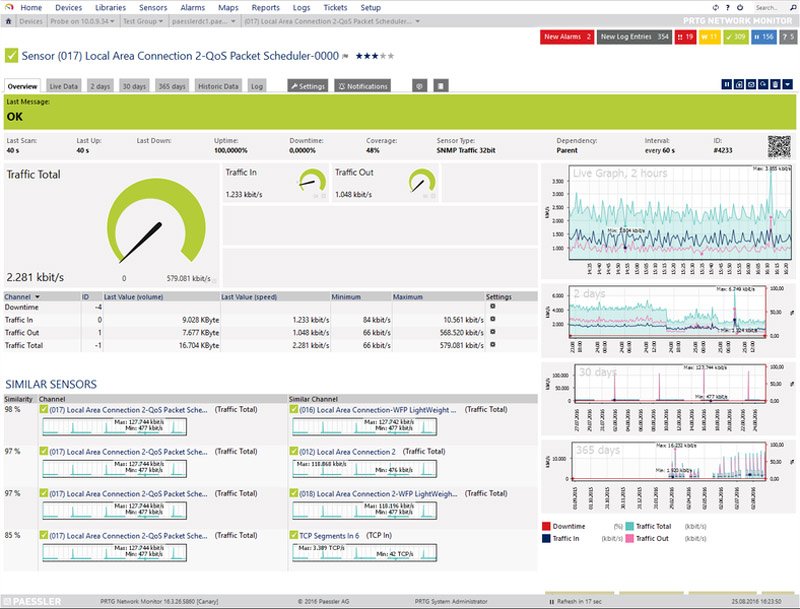
PRTG “Paessler Router Traffic Grapher”, focuses strictly in network infrastructure monitoring. It is able to check on systems, appliances and applications. All of the functionalities from it can be installed with a single installer and without needing to download any add-ons.
PRTG runs on Windows and is able to monitor network availability and utilization using SNMP among other protocols. It is also able to automatically discover systems and devices by analyzing different IP networking segments. From this information
PRTG can create network maps which can be published on the web for easy analysis. You can purchase the basic service PRTG 500 for $1,300, which allows monitoring up to 500 sensors (sensors are aspects monitored on a device).
Official Website:
3. OpManager
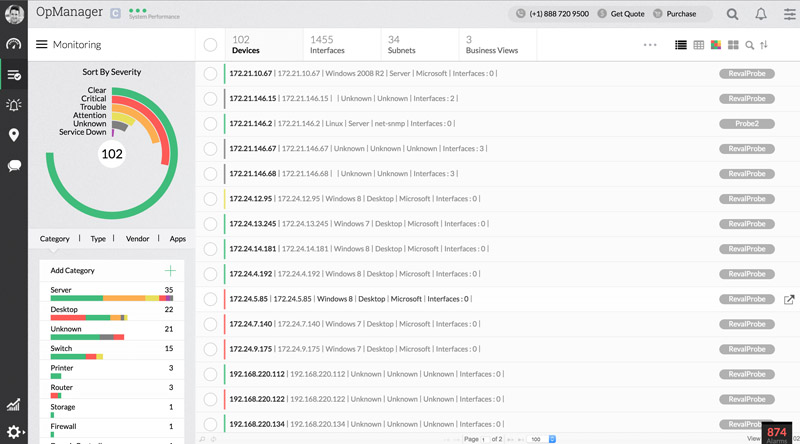
OpManager is a tool by ManageEngine. OpManager helps an administrator keep a close eye on the infrastructure, network and the Application Performance Management “APM”. It can be used for either Windows or Linux environments.
OpManager is an integrated network management application that allows you to focus on one tool instead of separated networking features. Installing the manager is really easy and once installed it will automatically discover up to 15,000 network interfaces – you can see our full ManageEngine Opmanager review here for more details.
The User Graphical Interface makes it very easy to use and also highly customizable. OpManager best features include Network and Server management, traffic analysis, network configuration management and fault and performance management. The essential edition, for up to 25 devices can be purchased for $595. We've written up an extensive review of ManageEngine Opmanager for you to get a better understanding of its benefits and features.
Official Site:
https://www.manageengine.com/network-monitoring/
4. Nagios XI and Core
Nagios XI and Nagios Core, are two monitoring tools from Nagios, a leader and standard bearer in IT infrastructure monitoring.
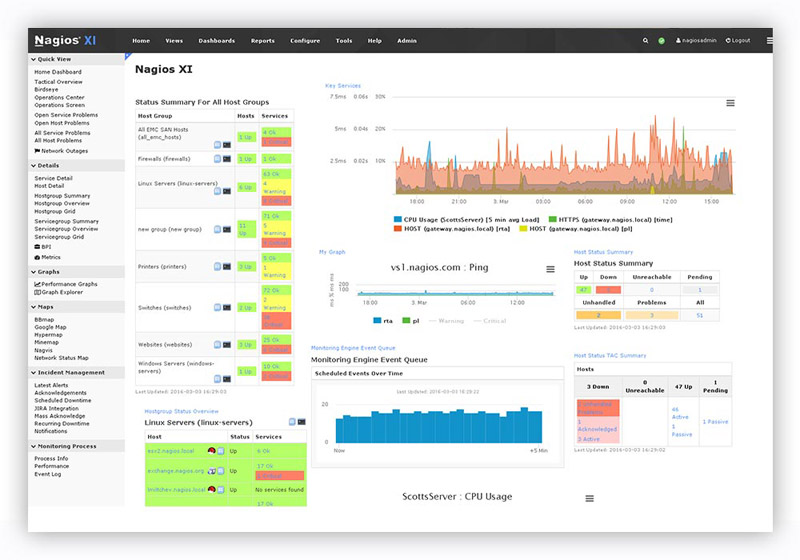
Nagios XI is a network monitoring tool that can be highly customized to turn itself into a powerful monitor for isolated or particular circumstances. Nagios XI is easy to install, but it needs to be tweaked a lot to meet your specific needs (Manual Editing of Configuration files, plugins, etc.).
Since the tool does not automatically discover devices, you need to indicate each device through a configuration file, only then, the tool will start sending alerts. It can be purchased starting at $1995 for 100 nodes.
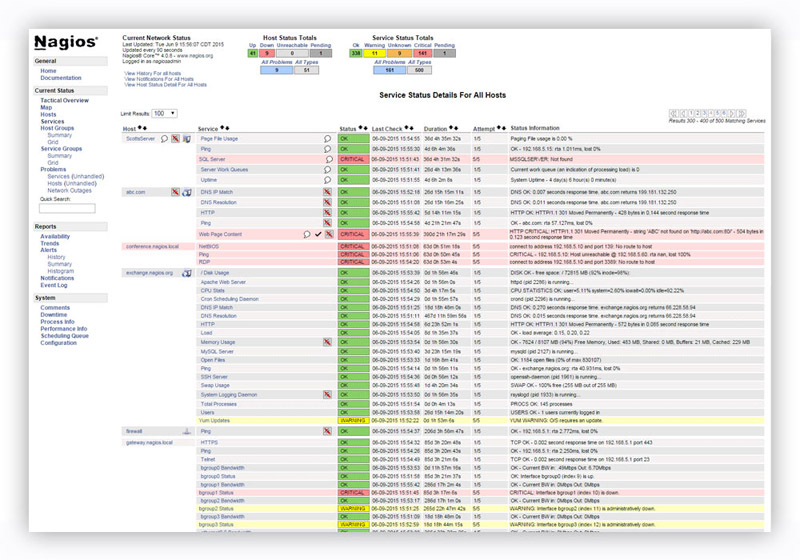
Nagios Core is the free and open source version. Not to underestimate this freebie, Core is powerful infrastructure monitoring and alerting software. This tool is very easy to download, install and use but of course it has its limitations, the reporting and user-interface are very restricted.
Nagios XI, uses Nagios Core as its engine. Since Core is open source there are many plugins and add-ons in the community that can work with this software to extend the capabilities.
Official Website: https://www.nagios.com/products/nagios-xi/
5. WhatsUp Gold
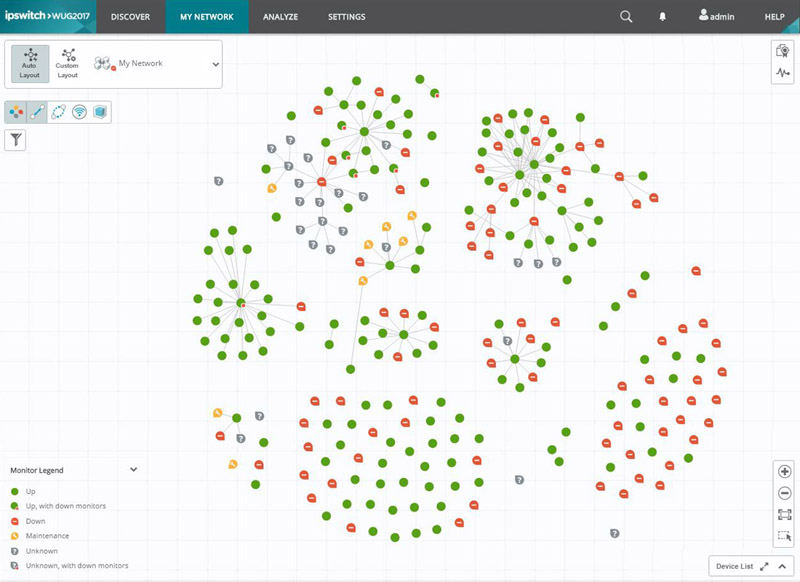
WhatsUp Gold Network monitoring tool from IPSwitch, comes with advanced visualization features that makes the main dashboard really appealing. Whatsup Gold allows you to monitor networks, servers, applications, VMs and traffic flows. The interactive network map lets you visualize the complete network and find problems easily.
The installation process is really simple; the add-ons can be included right from the start. The basic version can be purchased with a starting fee of $1755 (a onetime license).
Official Website:
https://www.ipswitch.com/application-and-network-monitoring/whatsup-gold
6. Zabbix
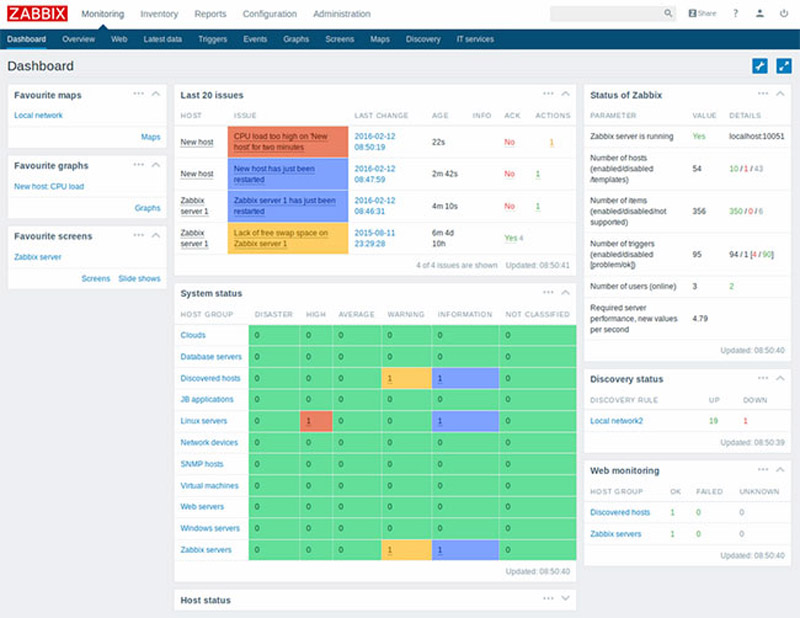
Zabbix is an open source enterprise and free monitoring tool. It is a great tool for monitoring hosts and services for small to medium networks. But when it comes to large networks, Zabbix can become difficult to scale up, as service discovery becomes complicated.
The tool comes with light weight agents to install in servers (either Unix or Windows) and can monitor statistics like network utilization, CPU load, memory, etc. The open source community of Zabbix is really helpful when solving configuration related issues and customization.
Official Website:
7. Spiceworks Network Monitor
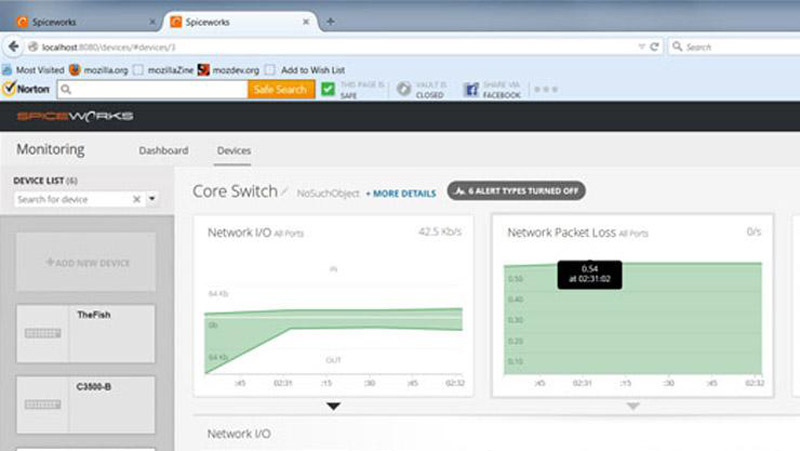
Spiceworks Network Monitor is another free tool great for small to medium sized Windows networks. The tool allows you to monitor servers, services and devices like routers or switches through SNMP protocol.
The tool is very easy to install and use. Its graphical interface is very intuitive for anybody with decent knowledge on networks. The downside of the tool is that it lacks customization to create alerts and notifications. Since the tool doesn’t have granularity at the moment of configuration, it is not suitable for large enterprises.
Official Website:
Conclusion
Besides the tooling to monitor your systems, you need a protocol in place for solving problems and responding to incidents. Best practices for system monitoring call for forethought and attention to design.